There are no limits on the number of views you can create and there is no right or wrong on how many there should be in a workspace. The number can depend on the count of projects you’re tracking, on how different those projects are, how much data and to whom is being reported, and so on.
Creating multiple views based on the same set of projects may be useful for when you intend to share those views with different audiences. This allows every view to be tailored in content and appearance, and if needed, can help minimize the number of actions the viewer will have to perform to get the information they seek.
Nonetheless, having multiple configurations within one view is an equally reasonable solution that can add to the convenience of use and greater interaction possibilities.
To create a view:
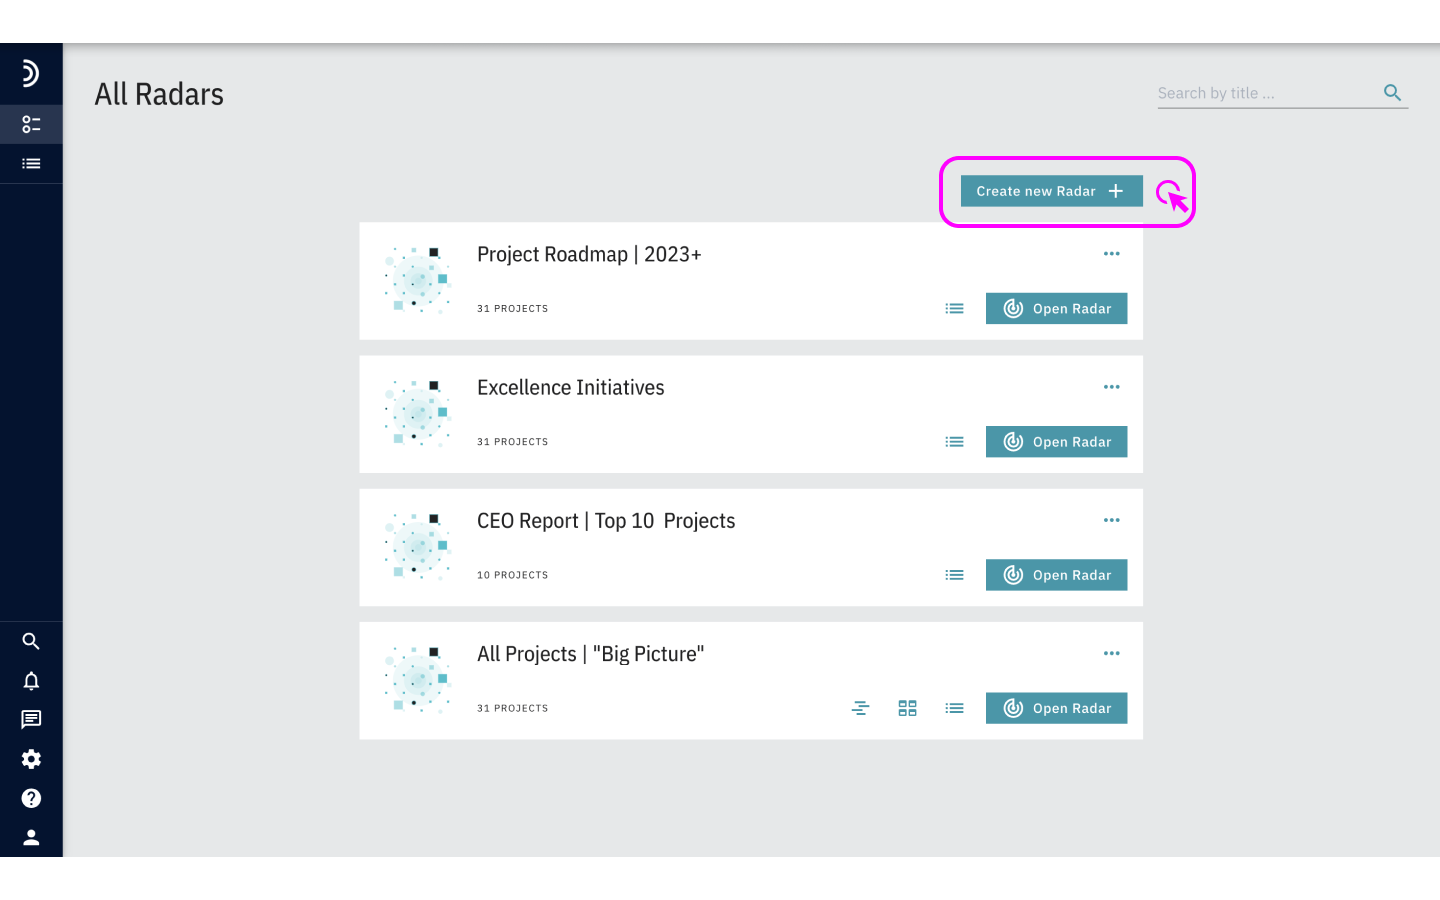
1. Click the “Create new Radar +” button in the list of views.
2. In the Basic Settings section, enter a view name.
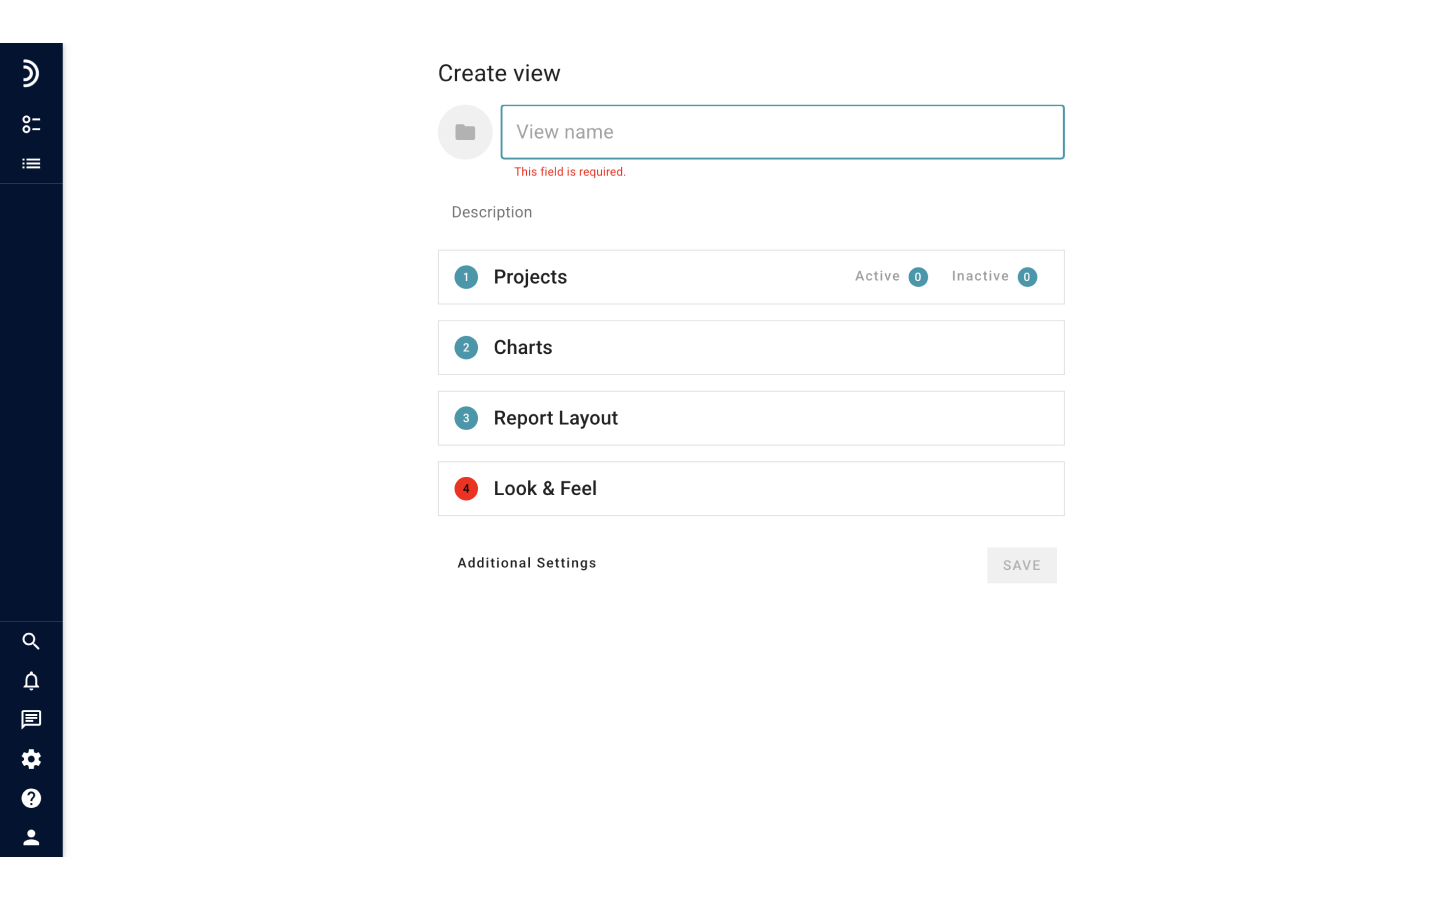
Optional: Write a description to provide more information about the view and how to use it.
3. Click on the “Projects” panel.
Optional: In the Projects section, check the boxes next to the projects on the Active and Inactive tabs that you want to include in the view. You can select all projects on the tab by checking the very top box.
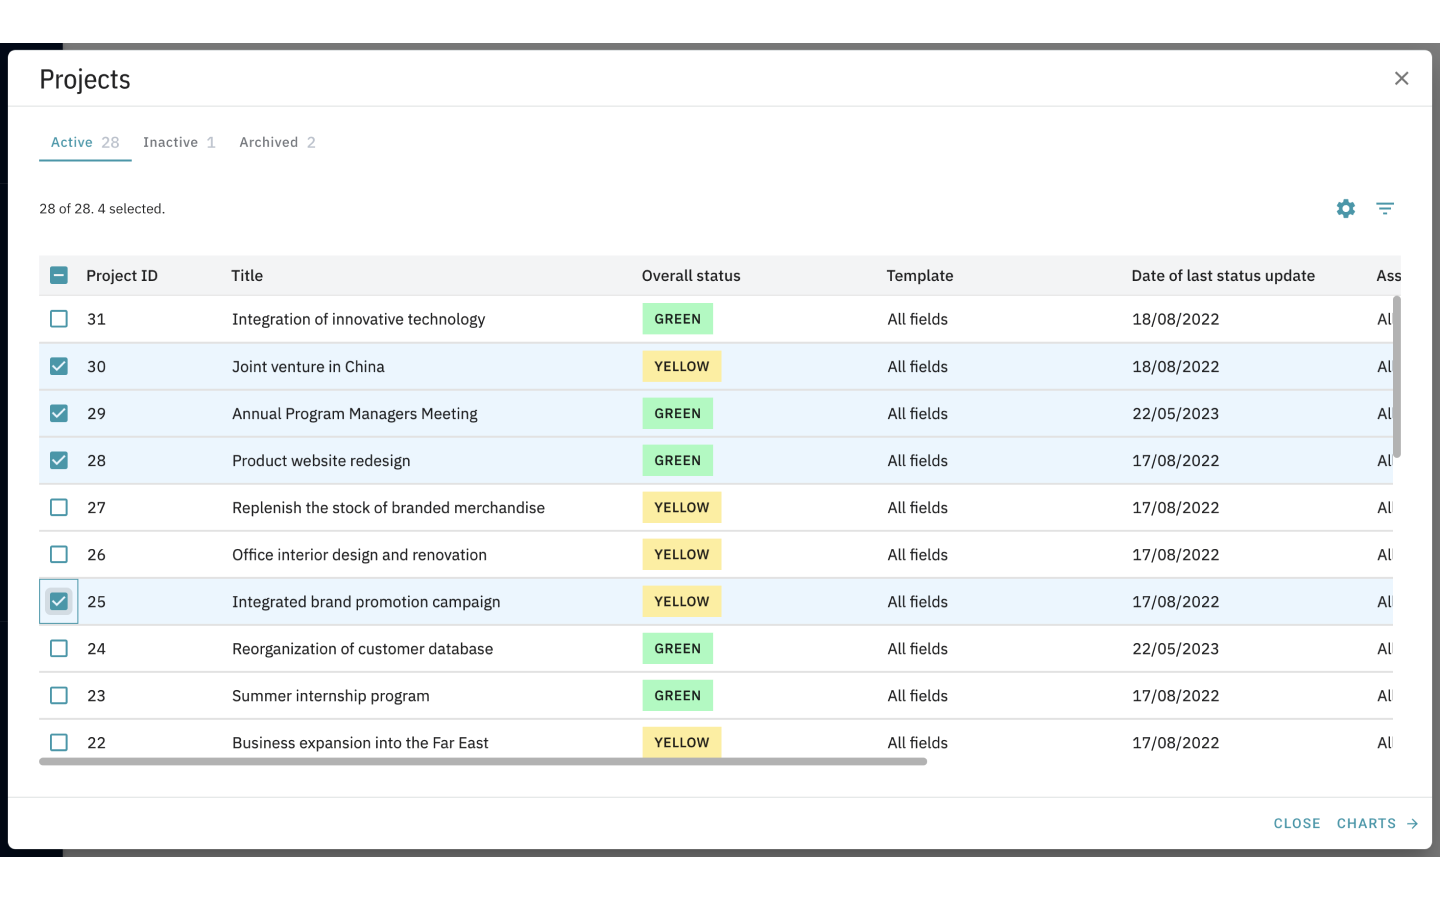
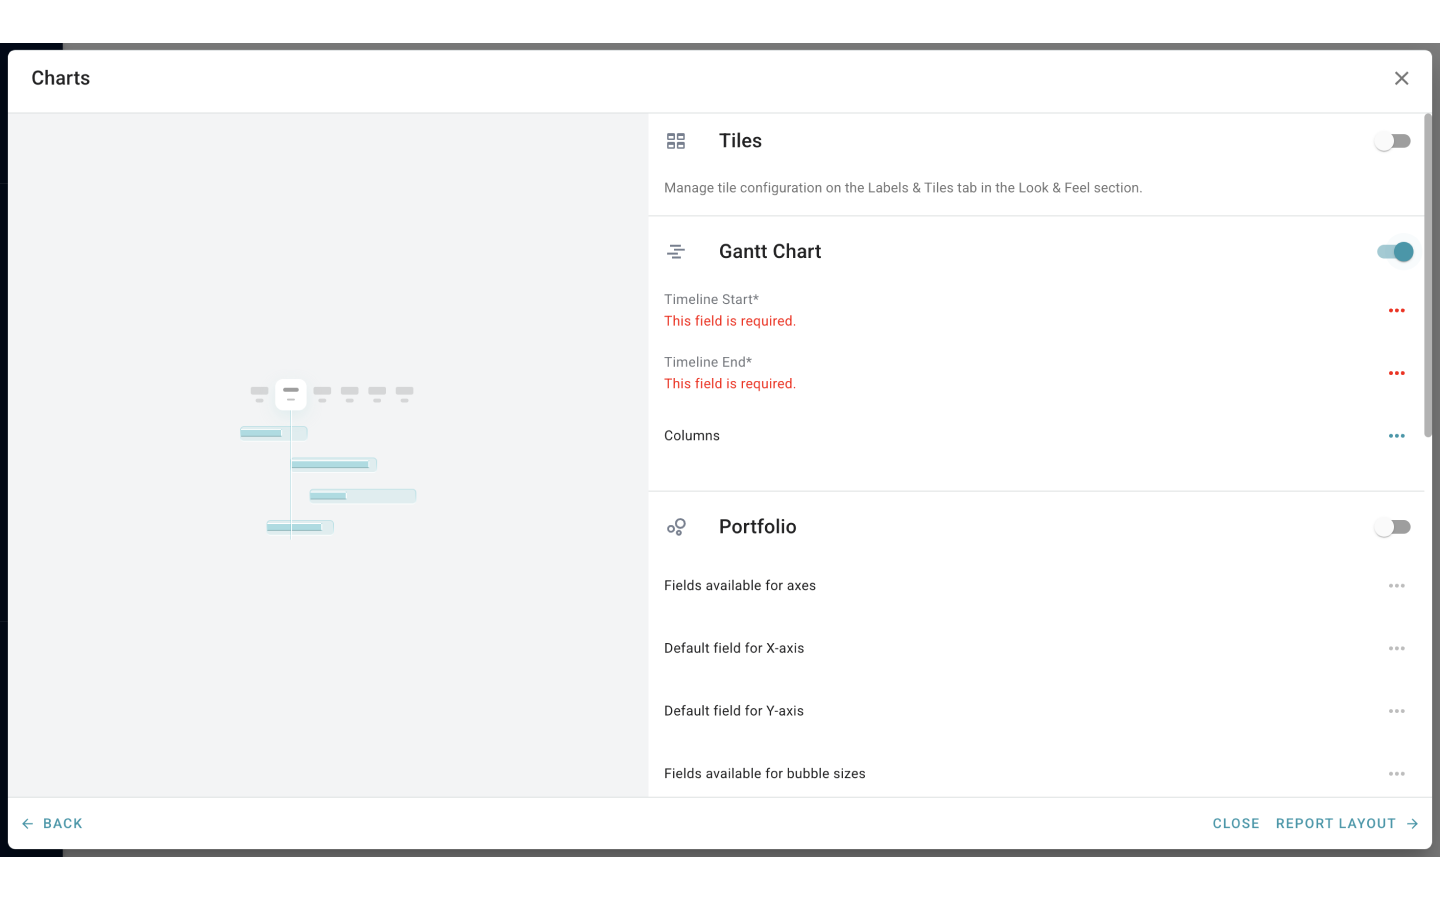
4. Click Charts
Optional: In the Charts section, switch on additional views of reports, like Tile, Gantt chart, and Portfolio. Set up configuration of the views.
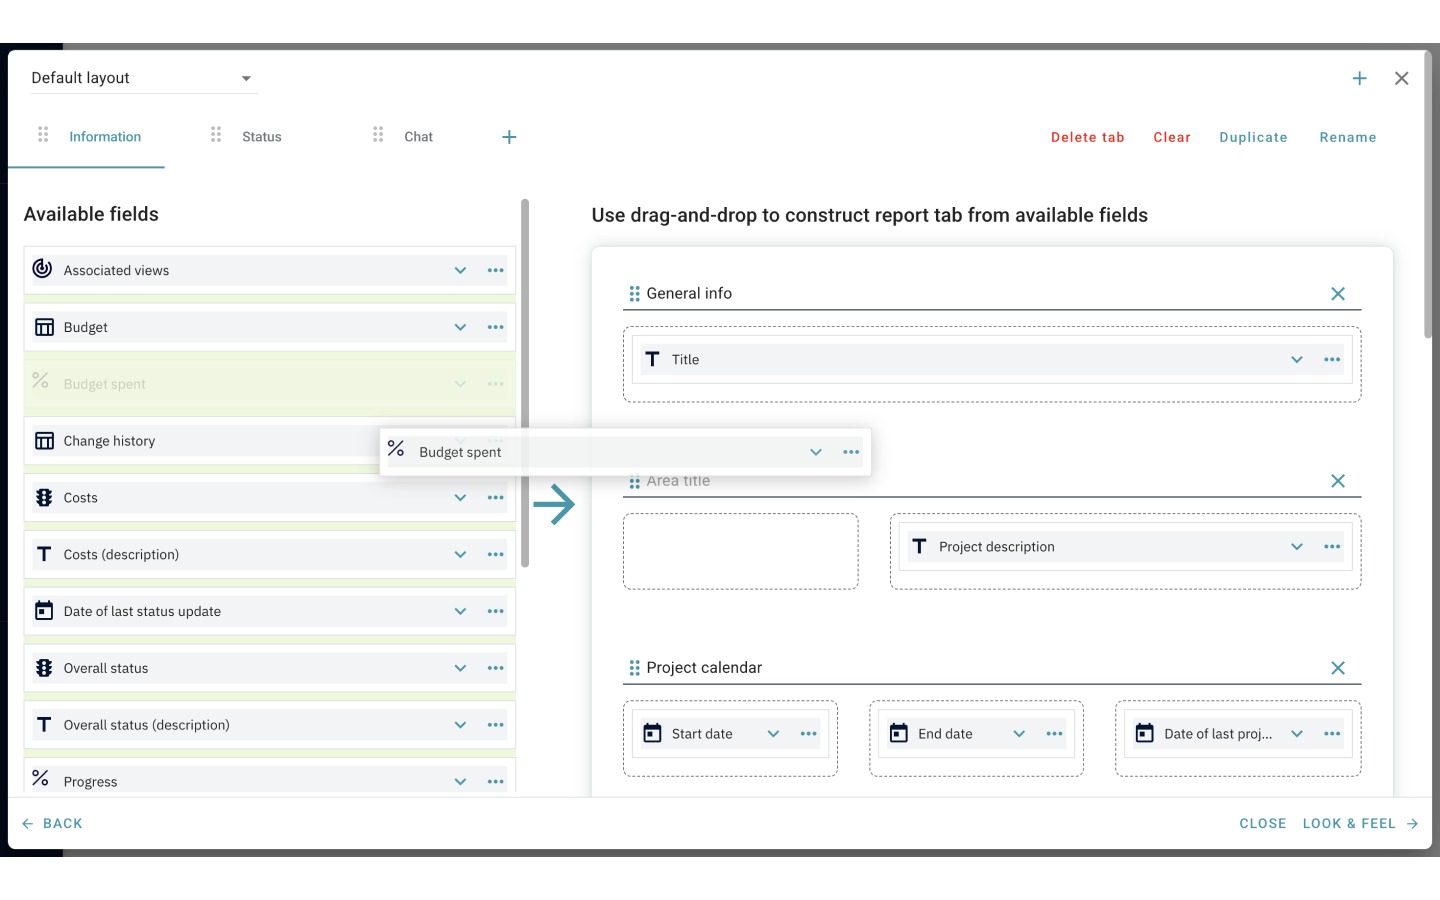
5. Click Report Layout
Optional: In the Report Layout section, scroll down the list of field cards available for use to find the ones you want to include in the report.
6. Click one of the card headers, hold down the mouse, and drag the field to the layout area on the right.
7. Drag and drop fields one by one, create new placeholders by clicking the “+ Add Placeholder” button below the report layout, change visual representation of field values by selecting them from the “…” menu until you are satisfied with the structure of your report.
8. Click Look & Feel
9. Select one or more fields that you want to associate with Radar sectors.
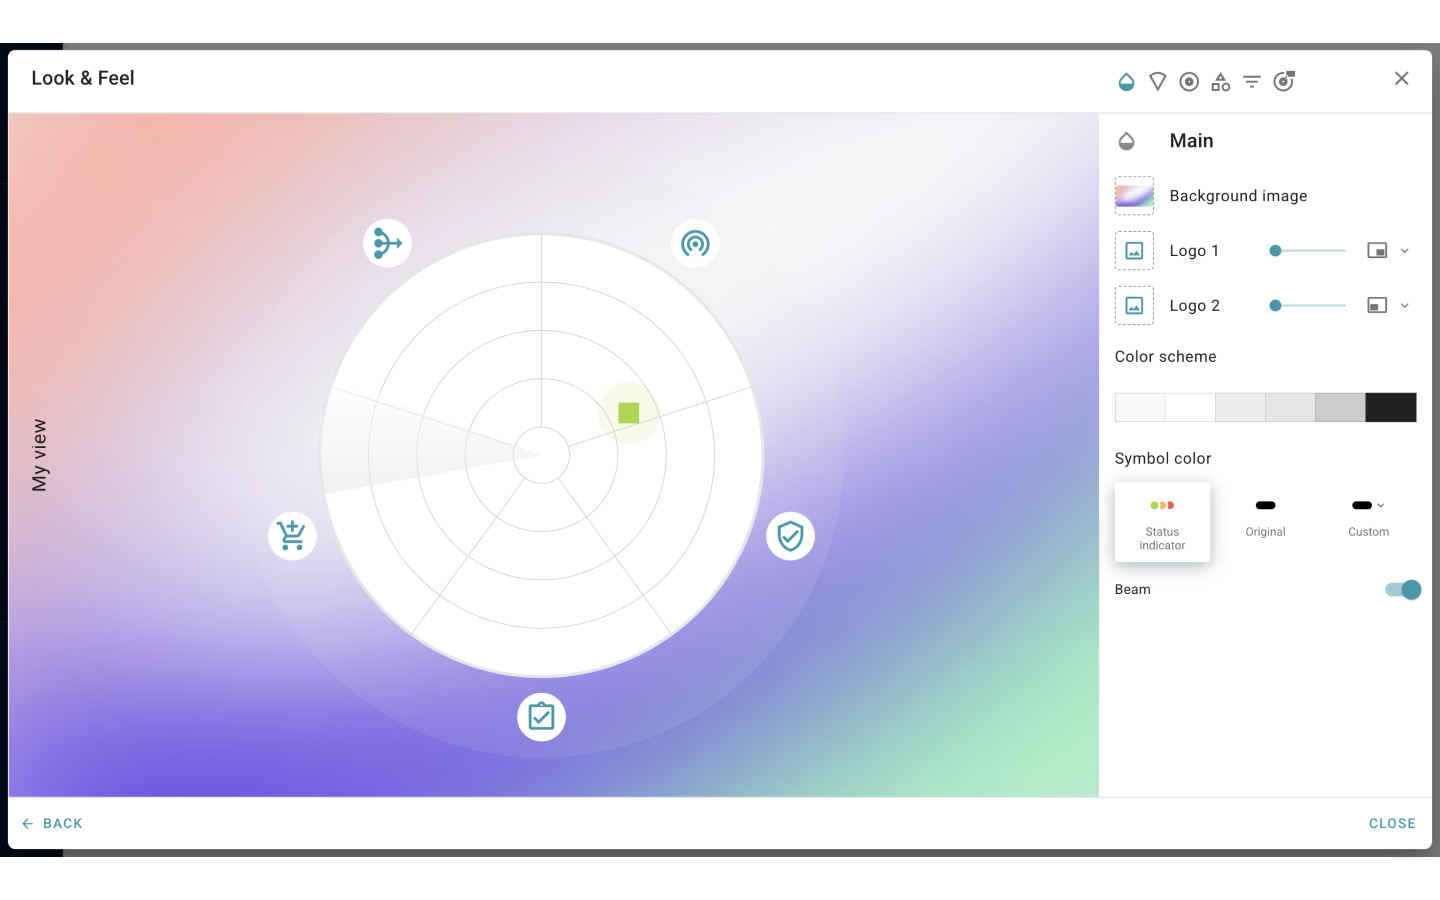
10. Indicate which one of the selected fields should serve as a default sector value and be displayed first when a view is opened.
11. Repeat the previous two steps for rings and symbols on the corresponding tabs.
12. Click Close.
The steps above constitute the minimum setup necessary to get a view to work. Each of the four settings sections offers many more options and features that allow customizing views to the smallest detail.