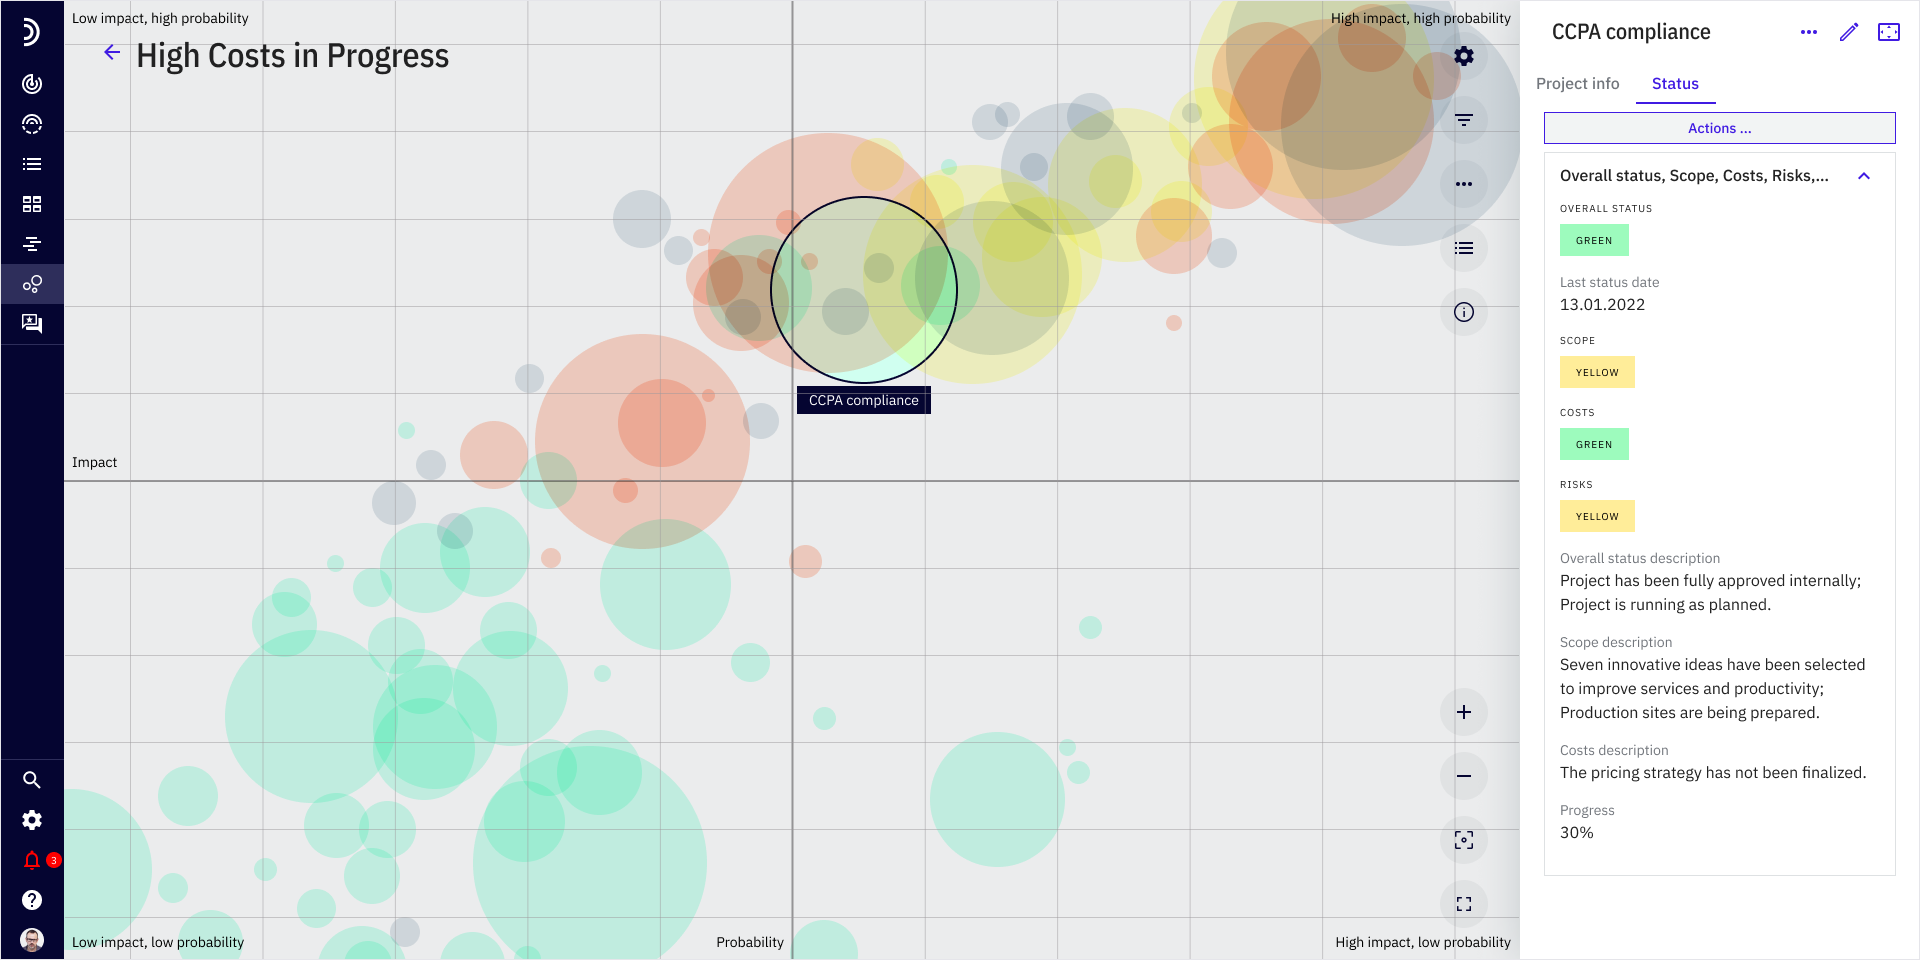
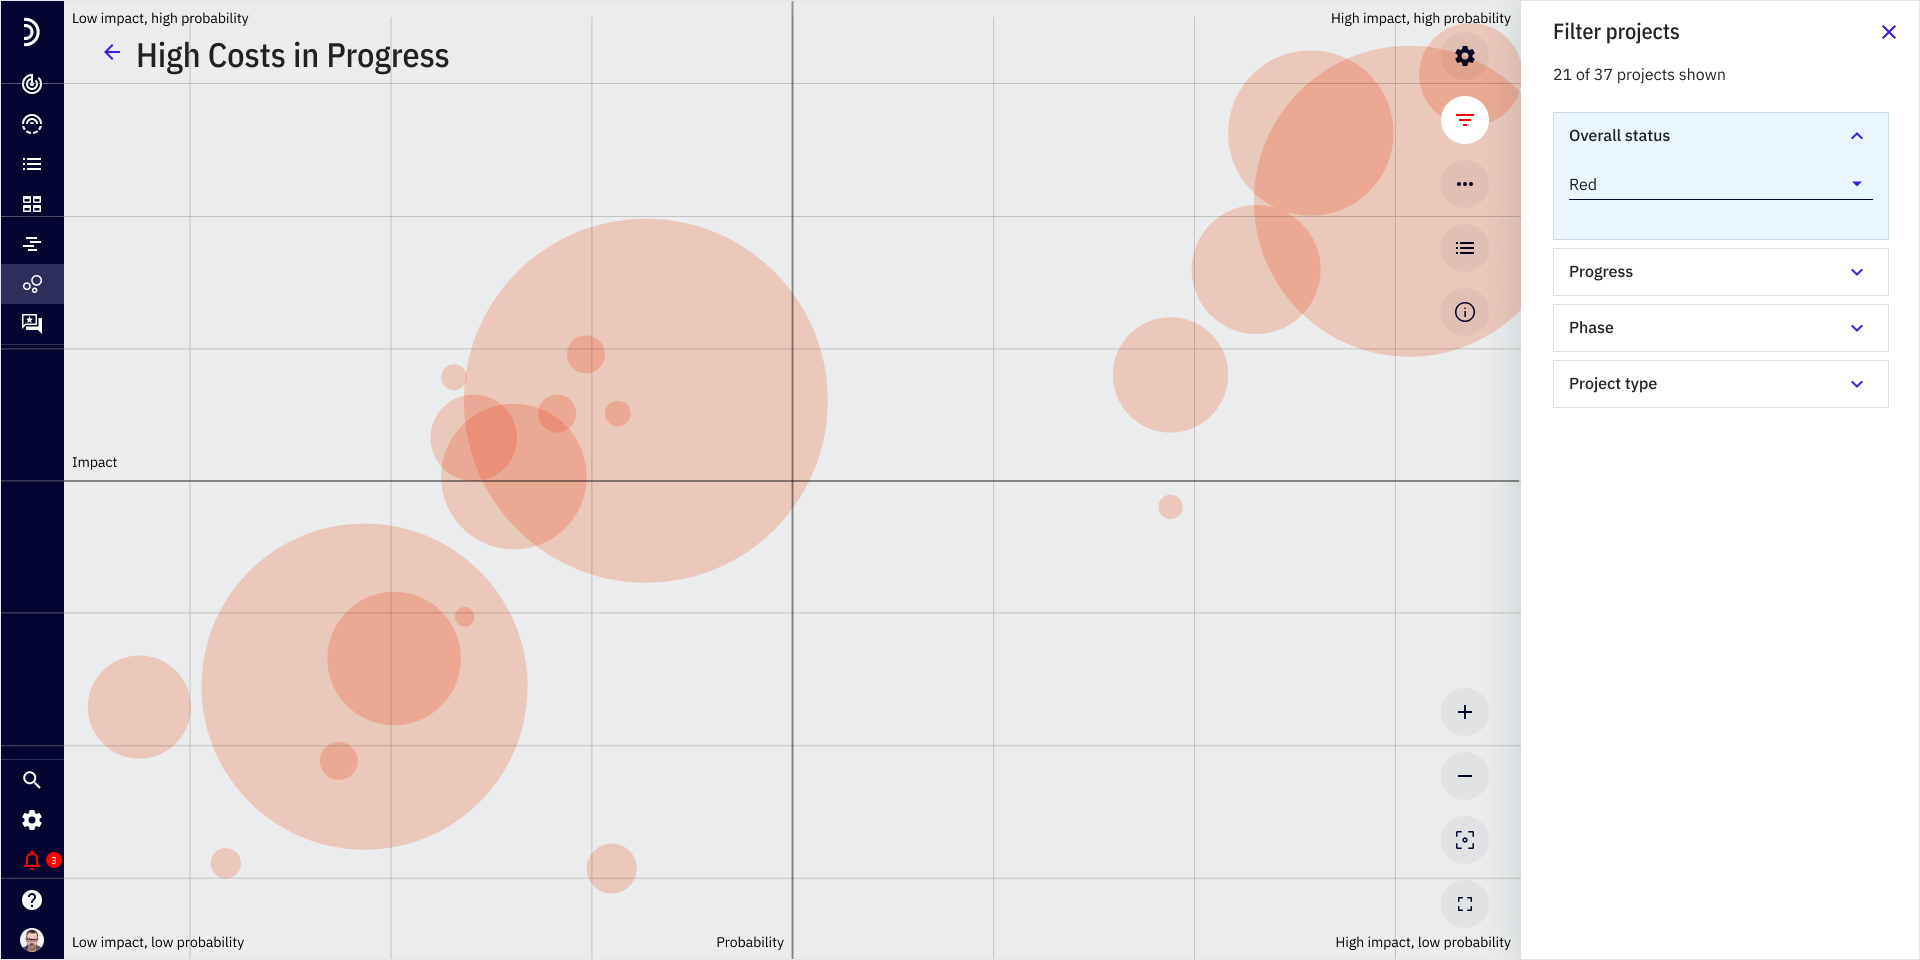
View your project portfolio on the bubble chart
We are glad to present you a new way to visualize project data in Radar – bubble chart.
The bubble chart has long been a standard tool for project managers around the world. With it, you can view a portfolio of projects, focusing on the ratio of two parameters, for example, risks and rewards, or technical and market newness. In addition, the size of the bubble allows you to display the budget of the project or the time spent on its implementation.

Now you have even more data visualization options in Cloud Radar application (Radar, Cockpit, Project List, Tiles, Gantt Chart and Bubble Chart), which means you can customize reports suitable for any recipient and for any situation.

Turn on Bubble Chart in the radar settings and use flexible chart customization options: choose chart axes and bubble sizes, add labels to chart areas, filter data, scale and move around the chart.