Customise Consent Preferences

We use cookies to help you navigate efficiently and perform certain functions. You will find detailed information about all cookies under each consent category below.

The cookies that are categorised as "Necessary" are stored on your browser as they are essential for enabling the basic functionalities of the site. ... 

Always Active

Necessary cookies are required to enable the basic features of this site, such as providing secure log-in or adjusting your consent preferences. These cookies do not store any personally identifiable data.

No cookies to display.

Functional cookies help perform certain functionalities like sharing the content of the website on social media platforms, collecting feedback, and other third-party features.

No cookies to display.

Analytical cookies are used to understand how visitors interact with the website. These cookies help provide information on metrics such as the number of visitors, bounce rate, traffic source, etc.

No cookies to display.

Performance cookies are used to understand and analyse the key performance indexes of the website which helps in delivering a better user experience for the visitors.

No cookies to display.

Advertisement cookies are used to provide visitors with customised advertisements based on the pages you visited previously and to analyse the effectiveness of the ad campaigns.

No cookies to display.

Change project data on the fly

Apr 27, 2023Product Release

One of the main advantages of using Projects Radar is the ability to flexibly customize the appearance of status reports and the radar chart. We have received a lot of positive feedback from our customers about this functionality. Then we thought that we should give our users also the ability to change the data on the radar chart on the fly, for example, during a status meeting.

No sooner said than done! We are glad to present you a new version of Projects Radar, in which you can change project data and publish new status reports during the demonstration of the radar chart: just select a project on the radar, click on it and switch the appeared panel to edit mode by clicking on the “pencil” icon – that’s it! Now you can change the data, and the project will update its position, shape and color on the radar chart immediately after saving.
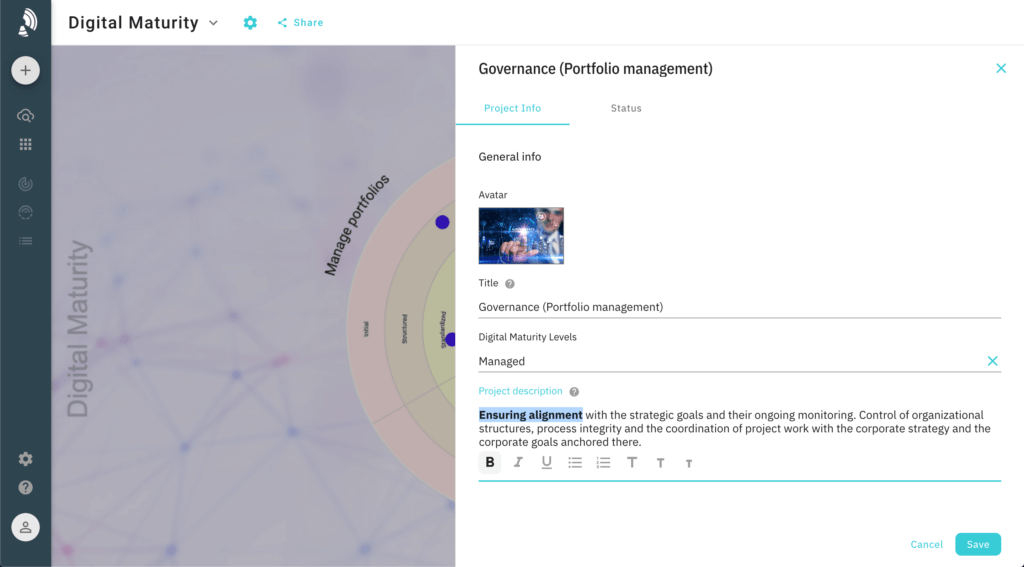
Make status meetings interactive with the new Projects Radar features.